Simple table summary companion
September 1, 2011
java swing jtable tables swingxCode can be found on Github - https://github.com/ivanporty/swingtools
Sometimes it may seem that standard Swing JTable or its close companions like SwingX JXTable are too limited. You don’t have too many funny ways to manipulate them – they are strict rectangular grids, with every row taking fixed amount of screen space in pixels and columns taken from one and only column model. Columns cannot be spanned or split and always take a single cell in the grid.
However there’s a reason why tables are so strict in implementation – performance. Swing tables are extremely speedy when you bake them right – don’t calculate anything in getValueAt() method of table model, do not over-use bulk updates of table model and change its structure, preferring to use single-cell focused, precise updates, and don’t use expensive rendering like built-in HTML. Fixed row height allows you not to query all of the rows even if you have millions of them – you can predict and calculate table’s height and show it appropriately inside of the container (most probably a scrolling pane) just by asking model how many rows it contains.
The other thing is to keep model as simple as possible. Indeed, you basically only need to know how many rows you have and what is in the cells for each row. No one will ask you about more data if it’s not shown on the screen. This allows us to use very clean table solutions like the bean reflection one we’ve discussed and implemented earlier in the blog.
But making tables much more powerful does not need a complete re-write. Let’s consider the situation when we need a summary row or even a few rows below the main table. In most cases, data in a summary does have a relation to “main” data, but they are not the same, rather they should behave like they are in the same table. So the design question is – will you keep the summary data in the same model or in a separate model. This potentially mean keeping fields and objects with summary data in the main data collection, thus replacing clear meaning of main table objects with something else, i.e. keeping summarized string name instead of plain “name”, controlling sorting so that summary rows won’t change their positions etc. This does not lead to clean and robust code.
To keep the code as clean as possible, let’s consider we have separate models and data collections for main and summary table, and they both can be shown in the model, for example with our bean reflection model. How do we show them as “one” table without user being able to even notice that he works with two tables? The answer is to share the table column model. This will share the renderers, editors and will automatically change order of columns for a second set of columns. The only thing needed is to have the column count and their data types to correspond between two tables – otherwise the renderers or editors may fail to understand them. Everything else is a little bit of layout magic – we’ll position tables on top of each other, make sure that scroll panes work well together and share the column model.
We’ll position tables in a panel with border layout, main table is going to take most of the space in the center, and summary one will have the remainder at the bottom, both stretched horizontally to the edges of the container, as BorderLayout implies. Here is our panel class and its constructor:
public class SummaryTablePanel extends JPanel {

  protected final JTable mainTable;

  protected final JTable summaryTable;

  protected JScrollPane mainScrollPane, summaryScrollPane;

  /**
   * Creates a summary panel which lays and connects main and summary tables.
   *
   * @param mainTable Main table with the data
   * @param summaryTable Summary table with the summary data.
  All the headers and additional behavior will be stripped.
   */
  public SummaryTablePanel(JTable mainTable, JTable summaryTable) {

    setLayout(new BorderLayout());

    this.mainTable = mainTable;
    this.summaryTable = summaryTable;

    initComponents();

  }

}
Note that fields are protected, so one can override the panel and add some more enhancements and changes for the standard summary behavior. initComponents() method is used to lay out the tables, put them into the scrolling panes and make sure they behave correctly.
First two steps are putting tables into scrolling panes and sharing the column models. This step will fail if data types for columns differ for main and summary tables, so that would be a fail-fast step in our construction.
    private void initComponents() {
        // step 1 - add tables into their areas
        mainScrollPane = new JScrollPane(mainTable);
        add(mainScrollPane);
        summaryScrollPane = new JScrollPane(summaryTable);
        add(summaryScrollPane, "South");

        // step 2 - share the column model
        summaryTable.setTableHeader(null);
        summaryTable.setColumnModel(mainTable.getColumnModel());
}
Tables are put into appropriate positions wrapped into scrolling panes. Note that we are disabling table header for summary table to hide it and mimic the column set as one. Then column model from the main table is shared with the summary one – this will mean reflecting changes in columns sizes, their order on screen and dragging whenever user decide to change one of these things.
The next few steps are to tweak the visual appearance of the summary table to make sure it looks exactly as continued main table:
        // step 3 - remove unnecessary UI
        if ( summaryTable instanceof BaseTable ) {
            ((BaseTable)summaryTable).setFilterHeaderEnabled(false);
        }
        if (summaryTable instanceof JXTable) {
            ((JXTable)summaryTable).setColumnControlVisible(false);
        }
        // step 4 - use only necessary size
        summaryTable.setPreferredScrollableViewportSize(
                new Dimension(summaryTable.getPreferredSize().width,
                summaryTable.getRowHeight() * (summaryTable.getRowCount() == 0 ? 1 : summaryTable.getRowCount()) + 1));
We’re checking if the summary table is instance of our BaseTable with more features and disable filter header for it, just in case it was enabled. If table is generic SwingX JXTable, we’re hiding its column control, which may be enabled, so that the client programmer can safely create the summary panel and not think about those minor details. The very important thing is to set appropriate size for summary table inside of the scrolling pane. We cannot set the table preferred size directly since it is in the scrolling pane, instead we’re using setPreferredScrollableViewportSize() method which allows us to change the preferred size of scrolling pane viewport. If there’s any data in the summary table, we’re setting the height to be equal to optimal height to show them – considering summary table will not contain too many rows. If there’s no data, we’re just use the size for single summary row. If you want more flexible approach for your summary rows, you can override this component and do the size tweaking according to your needs.
Last thing would be having only one horizontal scroll bar for both main and summary tables so the users can get an impression of completely connected table with a separator between usual and summary rows. We most probably don’t want synchronized scrolling on vertical side – users probably will position usual data rows differently from summary rows, but horizontal scrolling, if enabled, should be connected. Again, this is something you can always add later in a similar fashion.
        // step 5 - adjust and connect scroll bars from scroll panes
        summaryScrollPane.setColumnHeader(null);
        summaryScrollPane.setHorizontalScrollBarPolicy(JScrollPane.HORIZONTAL_SCROLLBAR_NEVER);
        summaryScrollPane.getHorizontalScrollBar().setModel(mainScrollPane.getHorizontalScrollBar().getModel());
Here, we’re disabling the horizontal scrollbar for the summary table and only leave main one (potentially, if horizontal scrolling is enabled for the main table). That’s a matter of taste and visual design – the scrolling bar thus appears between main and summary tables, strongly separating them. The other approach is to have it on summary table, at the bottom, with less separation between tables, and behaving as one, but potentially confusing to see the separation line between two. To make two scrollbars from different scrolling panes to behave as one, we’ll use the famous Swing shared model feature again – and just share the model from main scrolling pane scrollbar with the summary one.
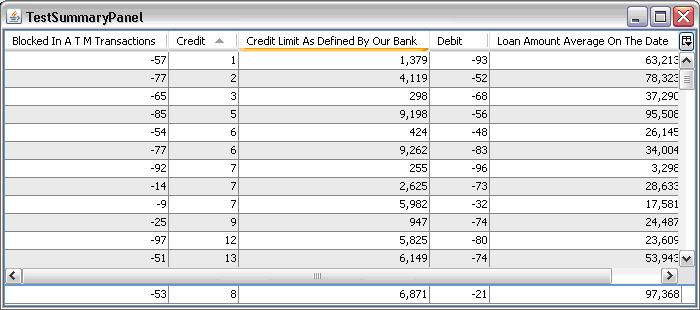
To see everything is the action, you can download the latest source code of the tools project from https://github.com/ivanporty/swingtools and run the TableSummaryTest test class. This is a Swing FEST based test class which tests various UI aspects of our new compound component. It uses dynamic bean reflection table model to quickly construct tables. Before it runs you can make pauses a bit longer to see and touch how summary table behaves.
Similar approach can be used to emulate divided blocks of rows or columns visually looking as being in a single table, keeping the elegancy and accuracy of simple clean table models. Clean data models focused on specific data types can be more important to keep code understandable and robust then monstrous Excel-like table which keeps everything in one model which quickly becomes rather UI than data driven with all the consequences of having UI code creep into the business logic.